


As a data analyst, having a strong command of Microsoft Excel is essential for effective data analysis. Excel is a powerful tool that offers a wide range of functions to manipulate and analyze data. In this comprehensive guide, we will explore the most useful Excel formulas for data analysis, providing you with the knowledge and skills to enhance your analytical capabilities.
What are Excel Formulas for Data Analysis?
Excel formulas are functions that enable you to perform calculations and manipulate data within cells. These formulas allow you to automate tasks, make data-driven decisions, and extract valuable insights from your datasets. By utilizing Excel formulas, you can save time and effort while conducting complex data analysis.
CONCATENATE: Combining Data from Multiple Cells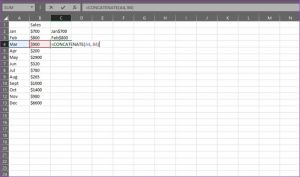
The CONCATENATE formula is a fundamental function in Excel that allows you to combine data from multiple cells into a single cell. This is particularly useful when you need to merge text, numbers, or dates from different cells. For example, you can use CONCATENATE to combine a person’s first name and last name into a full name.
To use the CONCATENATE formula, you need to specify the cells you want to combine. For instance, if you have the first name in cell A2 and the last name in cell B2, the formula would be:
=CONCATENATE(A2, " ", B2)
This formula would result in the full name being displayed in the cell where the formula is entered.
LEN: Counting Characters in a Cell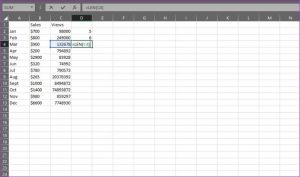
The LEN formula is another valuable function for data analysis, as it allows you to determine the number of characters in a cell. This is particularly useful when working with text that has specific character limits or when differentiating between unique identifiers.
To use the LEN formula, simply specify the cell you want to count the characters for. For example, if you want to count the characters in cell A2, the formula would be:
=LEN(A2)
This formula would return the total number of characters in cell A2.
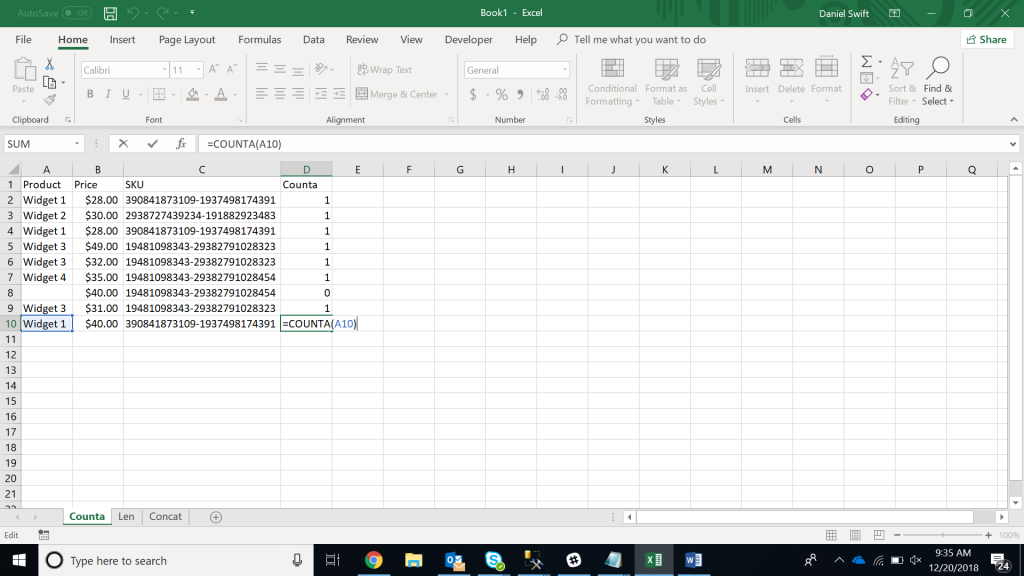
COUNTA: Handling Incomplete Datasets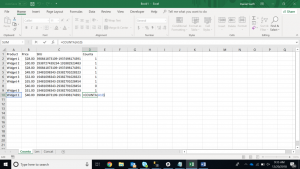
As a data analyst, you often encounter incomplete datasets. The COUNTA formula in Excel can help you analyze and work with these datasets without restructuring them. The COUNTA formula determines whether a cell is empty or contains data.
To use the COUNTA formula, specify the range of cells you want to evaluate. For example, if you want to count the non-empty cells in column A, the formula would be:
=COUNTA(A:A)
This formula would return the total number of non-empty cells in column A.
VLOOKUP: Matching Data from a Table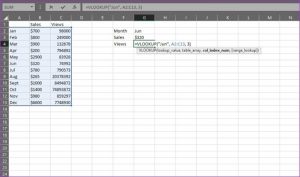
The VLOOKUP formula is one of the most commonly used functions in Excel for data analysis. It allows you to search for a specific value in a table and retrieve information from another column related to that value. This is particularly useful when combining data from different tables or comparing two lists.
To use the VLOOKUP formula, you need to specify the value you want to look for, the table range, the column index number, and the range lookup (exact or approximate match).
=VLOOKUP(lookup value, table array, column index number, range lookup)
For example, if you have a table with employee names in column A and their corresponding salaries in column B, and you want to retrieve the salary for a specific employee, you would use the VLOOKUP formula:
=VLOOKUP(employee name, table range, 2, FALSE)
This formula would return the salary for the specified employee.
MINIFS/MAXIFS: Finding Minimum and Maximum Values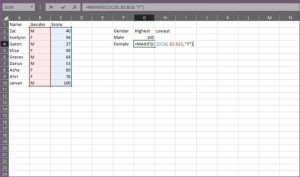
The MINIFS and MAXIFS formulas are extremely useful for finding the minimum and maximum values that meet specific criteria. These formulas allow you to set criteria and find the minimum or maximum values based on those criteria.
To use the MINIFS formula, specify the range to evaluate and the criteria range(s) and criteria(s) to meet. For example, if you have a dataset with sales values in column A and want to find the minimum sales value for a specific region, you would use the MINIFS formula:
=MINIFS(sales range, region range, region criteria)
This formula would return the minimum sales value for the specified region.
Similarly, you can use the MAXIFS formula to find the maximum value that meets specific criteria.
AVERAGEIFS: Calculating Average with Multiple Criteria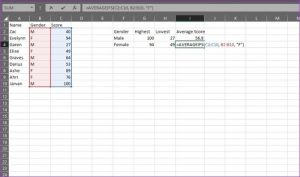
The AVERAGEIFS formula allows you to calculate the average of a dataset based on one or more criteria. This formula is particularly useful when you want to calculate different averages based on different criteria.
To use the AVERAGEIFS formula, specify the range to evaluate and the criteria range(s) and criteria(s) to meet. For example, if you have a dataset with sales values in column A and want to calculate the average sales for a specific region, you would use the AVERAGEIFS formula:
=AVERAGEIFS(sales range, region range, region criteria)
This formula would return the average sales value for the specified region.
COUNTIFS: Counting Values with Multiple Criteria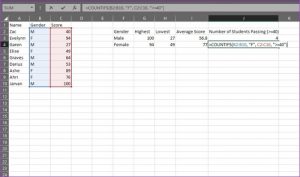
The COUNTIFS formula allows you to count the number of values that meet multiple criteria. This formula is useful when you want to count the occurrences of certain values based on specific criteria.
To use the COUNTIFS formula, specify the range to evaluate and the criteria range(s) and criteria(s) to meet. For example, if you have a dataset with customer ratings in column A and want to count the number of ratings that are above a certain threshold for a specific region, you would use the COUNTIFS formula:
=COUNTIFS(rating range, ">" & threshold, region range, region criteria)
This formula would return the count of ratings above the threshold for the specified region.
SUMPRODUCT: Multiplying Ranges and Summing Products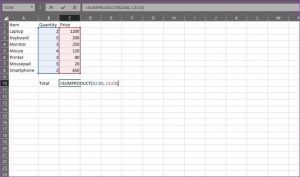
The SUMPRODUCT formula allows you to multiply ranges or arrays together and then sum the products. This formula is useful when you need to calculate average returns, price points, or margins based on multiple factors.
To use the SUMPRODUCT formula, specify the ranges or arrays you want to multiply and sum. For example, if you have a dataset with sales quantities in column A and sales prices in column B, and you want to calculate the total revenue, you would use the SUMPRODUCT formula:
=SUMPRODUCT(quantity range, price range)
This formula would return the total revenue by multiplying the quantity and price for each row and summing the products.
FIND/SEARCH: Locating Specific Text within a Dataset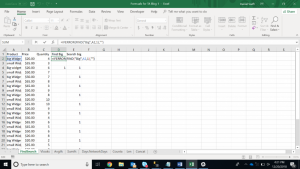
The FIND and SEARCH formulas are useful for isolating specific text within a dataset. These formulas allow you to locate the position of a specific word or phrase and return the corresponding number.
The FIND formula is case-sensitive, while the SEARCH formula is not case-sensitive. Both formulas prompt you to specify the text you want to find and the cell or range to search within.
=FIND(text, within)=SEARCH(text, within)
For example, if you have a dataset with product descriptions in column A and want to find the position of a specific keyword, you would use the FIND or SEARCH formula:
=FIND(keyword, A2)
This formula would return the position of the keyword within cell A2.
LEFT/RIGHT: Extracting Characters from Text
The LEFT and RIGHT formulas allow you to extract a specified number of characters from the start or end of a cell’s text. These formulas are useful when you need to extract specific parts of an address, URL, or reference for further analysis.
The LEFT formula extracts characters from the start of a cell’s text, while the RIGHT formula extracts characters from the end. Both formulas prompt you to specify the cell or range to extract characters from and the number of characters to extract.
=LEFT(text, num_chars)=RIGHT(text, num_chars)
For example, if you have a dataset with customer IDs in column A and want to extract the first two characters to identify the region, you would use the LEFT formula:
=LEFT(A2, 2)
This formula would return the first two characters of the customer ID in cell A2.
IFERROR: Handling Errors
The IFERROR formula allows you to handle errors in your calculations by displaying a more meaningful message or performing an alternative action. This formula is useful when you want to prevent errors from disrupting your analysis.
To use the IFERROR formula, specify the value or formula to check for an error and the action to perform if an error occurs.
=IFERROR(value, value_if_error)
For example, if you have a calculation that may result in an error, such as dividing by zero, you can use the IFERROR formula to display a specific message instead of the error:
=IFERROR(calculation, "Error: Division by Zero")
This formula would display the result of the calculation if no error occurs, or the specified error message if an error occurs.
Additional Excel Formulas for Data Analysis
In addition to the formulas mentioned above, there are several other Excel functions that can be valuable for data analysis. These include:
- SUM: Calculates the sum of a range of values.
- AVERAGE: Calculates the average of a range of values.
- COUNT: Counts the number of values in a range.
- INDEX: Retrieves a value from a specific row and column in a range.
- SUBSTITUTE: Replaces specific text within a cell with new text.
- UNIQUE: Extracts unique values from a range.
- And many more…
Understanding and utilizing these additional formulas can further enhance your data analysis capabilities in Excel.
Conclusion
Excel formulas are powerful tools for data analysts, enabling them to manipulate and analyze data effectively. In this comprehensive guide, we have explored the most useful Excel formulas for data analysis, including CONCATENATE, LEN, COUNTA, VLOOKUP, MINIFS/MAXIFS, AVERAGEIFS, COUNTIFS, SUMPRODUCT, FIND/SEARCH, LEFT/RIGHT, and IFERROR. By mastering these formulas, you can unlock the full potential of Excel for your data analysis tasks.
Remember to practice and experiment with these formulas to gain a deeper understanding of their functionalities. With time and experience, you will become proficient in utilizing Excel formulas for data analysis, making your analytical processes more efficient and insightful.
So, dive into Excel, explore its vast range of functions, and elevate your data analysis skills to new heights. Happy analyzing!
Experiencing difficulties with your Device, check out our “How To” page on how to resolve some of these issues.